Here’s how property operations teams are measuring (and improving) their work performance using the InCheck Executive Summary – and how your team can too:
We’ve talked before about the importance of measuring your team’s work output – knowing how you’re performing so you can adjust, weed out bad processes, and improve. Part of that is having actual, measured data – a record of how much work your team is completing, and whether or not they’re completing it to your satisfaction.
That’s where the InCheck Executive Summary comes in. The Executive Summary is one of the most popular InCheck reports, designed to deliver the data you need to improve your bottom line.
Read on to learn more about key Summary highlights, and how property operations teams nationwide are using it to help deliver the results they need.
Or if you want a quick summary (pun intended), scroll down below and check out our Executive Summary highlight reel.
Know How Efficient Your Team Is – Without Having To Guess
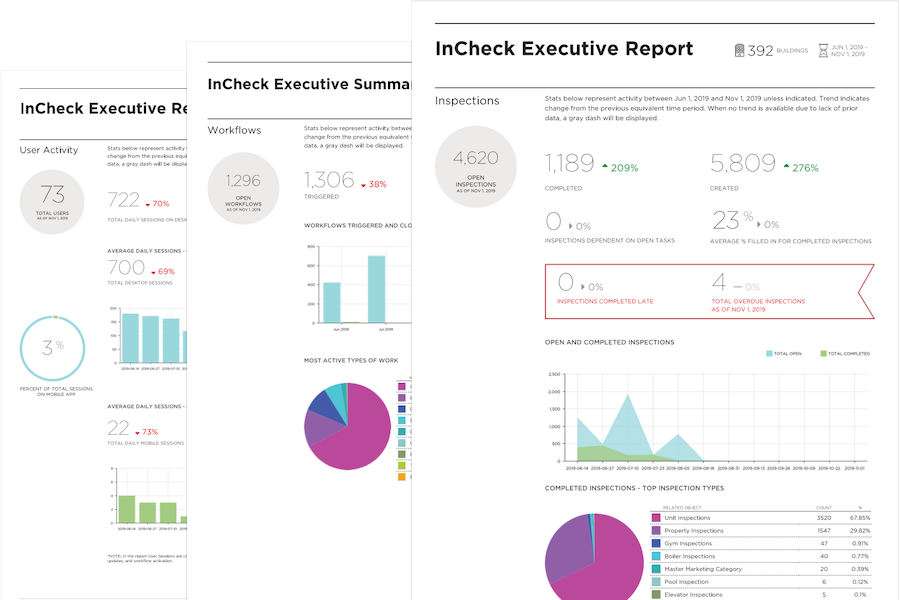
InCheck’s Executive Summary report analyzes your company’s work performance data and highlights where your team can improve, giving you an exact blueprint for increased efficiency, reduced risk, and better cost-savings across your portfolio.
One of the ways the Executive Summary does this is by aggregating all the things your team is doing – everything from assigned work to tenant responses and beyond. That data is shown in a number of ways, including the sample image below – a comparison of how much work is being assigned to your team every two weeks, and how much work is actually being completed in that same timeframe.
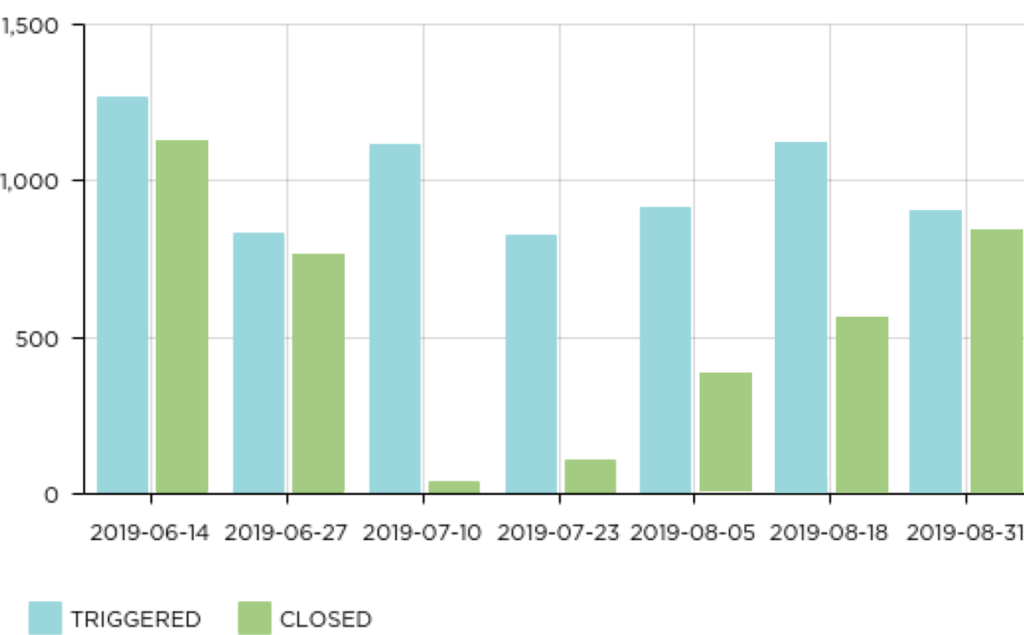
One of the Executive Summary data points shows assigned work versus completed work in the same timeframe. This way, you’ll immediately know what’s happening so you can focus on finding out the why.
In our chart, there’s a noticeable drop-off in completed work starting in July. Knowing this data makes all the difference – you can now determine why there’s a steep decline in work output (too much being assigned? Summer scheduling woes? Massive project taking up too many hours?) and adjust what you need to fix it.
And it’s not just how much work your team is completing – the Executive Summary lets you drill down and see the specific kinds of work that’s happening (or not), and how it’s changed over time:

Why is the construction process taking so much longer than it did last month? Now that you know what’s happening, you’ll be able to investigate and make improvements.
Beyond comparing work that’s assigned (triggered) and work that’s completed, you can actually see how long specific work is taking to complete, and whether or not that’s changed compared to the past quarter. Identifying which of your work processes aren’t working anymore is the first step to improving them, & making it easier for your team to execute on-time.
Optimize How Your Team Is Spending Their Time
One of the companies we work with wanted to roll out a renovation project for a large swath of units. That said, it was hard to find the right time to start the project without dramatically expanding their team (or worse, letting necessary work fall through the cracks).
After taking a look at their InCheck summary, the team noticed that an unusual amount of time was being spent on HVAC-related issues. In fact, HVAC-related work ended up being where they spent the vast majority of their time – taking away from other critical work like unit inspections and leaving little space for projects. Using this data, they were able to determine the root cause of this issue and make appropriate fixes (in this case, replacing outdated equipment), saving their team hours from related tenant responses and work.
And with those saved hours, they finally kicked off the unit renovation project – starting a major company goal as part of their multi-year success plan.

InCheck tells you exactly what kind of work your team is completing, giving you the data you need to rebalance output based on your company goals.
Seeing where your team is actually spending their time helps you better allocate your company’s resources and reach critical goals – without increasing costs.
Compare Work Metrics Across Properties, Teams, and More
For companies with sprawling portfolios and large staff counts, it can be difficult to ensure your policies and practices are always aligned at every property. The InCheck Executive Summary gives you the data to measure efficiency at different properties, property groups, and even working teams:

Compare how property groups, individual properties, and working teams are performing, and identify which ones need more support.
One group wanted to see the impact of a new portfolio-wide policy on all their buildings. With this data, the company was able to compare which property groups adapted quickly to the change without much interruption, and which groups needed more support. They were able to identify challenges (and implement solutions) before they became big, expensive problems.
The InCheck Executive Summary can be run on-demand, or set to automatically recur and deliver to key folks at your organization. It’s perfect for running postmortem meetings, quarterly executive reviews, or even monthly check-ins with building staff. And if you need a deeper dive into your company’s work practices and policies, we’ve got you covered. You can run summary reports for specific inspections, routines, processes, and more – all from your InCheck account.
Want to share this with your colleagues? Here’s our summary video on the InCheck Executive Summary: