From 2020 onwards, SiteCompli has been talking to property management teams across the city about how the pandemic impacted their properties and daily operations. One consistent trend we identified was the fall in violation counts in 2020, then the sharp rise immediately following the next year. With any drastic change, it’s important to go back and look at the numbers and try and identify any patterns.
We decided to dig into the violation data in light of these sharp changes – what did violation counts look like before, during, and after the pandemic? Did each agency face the same rapid bounce in violations?
Our State of NYC Violations Guide gives an overview and analysis of NYC violation data trends from 2019 – 2022 and what the data means for your team.
Click here to read the full report now and read below for one key highlight from each agency.
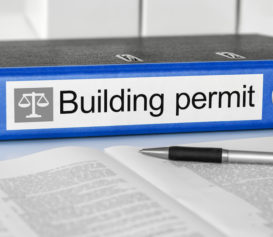
DOB
The Department of Buildings’ violation count has majorly fluctuated over the past few years. Here’s the total violation counts for each year:
| 2019 | 2020 | 2021 | 2022 |
| 84,600 | 48,285 | 81,440 | 56,808 (prorated) |
While the full report dives into these numbers further, here are some details about how they’re spread out across the boroughs. Brooklyn has consistently had the highest violations throughout all four years in comparison to the other five boroughs, with Manhattan and Queens following behind. It’s possible that construction in Brooklyn is a major cause for high numbers in the borough. Stay tuned to see if this changes given overall industry trends.
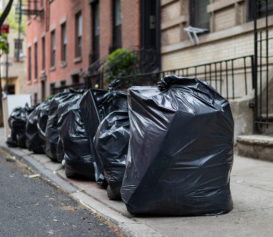
DSNY
The Department of Sanitation has been known to issue violations more frequently than other government agencies. Here’s a look at their recent violation counts:
| 2019 | 2020 | 2021 | 2022 |
| 344,118 | 176,965 | 261,148 | 276,338 (prorated) |
While there was a dip in violations in 2020 during the pandemic, Sanitation violations are on the rise. Failure to clean the street (Code AS26) was the top Sanitation violation in all five boroughs over the past four years. In terms of areas with the highest violation counts, Brooklyn, the Bronx, and Queens have the neighborhoods with the most violations issued.
Where is the city headed next when it comes to sanitation? Click here to read our recent post about new rule changes regarding trash pickup in an attempt to solve rat issues.
DOHMH
The Department of Mental Health and Hygiene saw their violation counts plummet from 2019 to 2020. Shortly after, they rose back up and are set to exceed violations issued in 2019.
| 2019 | 2020 | 2021 | 2022 |
| 33,607 | 6,535 | 22,669 | 39,700 (prorated) |
It’s important to note that the majority of these infractions are from unresolved rodent infestations (Code AH3N). Make sure your team responds quickly to all rodent and pest concerns, so your properties aren’t impacted by this agency’s rising violations trend.
FDNY
Although the FDNY’s violations have decreased from what they once were in 2019, Manhattan’s counts alone far exceed the other boroughs and maintained high counts throughout the past four years.
| 2019 | 2020 | 2021 | 2022 |
| 53,373 | 27,909 | 39,430 | 35,140 (prorated) |
Two factors that contributed to these numbers are unwarranted alarms and sprinkler system inspection and testing. Read the report for our full FDNY analysis, and why some of these trends might not be going away.
HPD
HPD is not part of OATH, but it does issue a vast number of city violations. Take a look:
| 2019 | 2020 | 2021 | 2022 |
| 612,898 | 431,842 | 713,498 | 773,342 (rated) |
The top five HPD Violations include:
- Paint and Plaster
- Repair
- Bedbugs
- Door
- Pests (General)
Other notable infractions are replace, mold, carbon monoxide detector, vermin, smoke detector, hot water, and window guards.
Bedbugs is a violation that was much less prevalent in years past but rose drastically over the past two years. Read the full report to find out why!
What do these numbers mean for you?
Starting the upcoming year on the right foot means examining old data and using it to create a strong compliance strategy for your team.
Adapt Plans to Location and Frequency
Violation counts are a useful tool in shaping your approach to compliance. Focus on allocating time, energy, and resources to areas where violation counts were steep.
Employ Proactive Prevention Strategies
Don’t put a band aid on a wound; when you fix a problem in a unit, take preventative measures to ensure the problem will not happen again and another violation won’t be issued.
Communication And Collaboration Are Key
- Touch base regularly to ensure strong, constant communication with your team – whether that’s virtually, in person, or messages and notes via your property operations software. That way, everyone on your team is aware of project status, next steps, and most importantly, getting things done on time to prevent further enforcement.
- Collaborate with vendors you trust to enhance your compliance strategy for the upcoming year. Focus on optimizing your team’s processes, conducting more thorough inspections, and applying industry best practices to your day-to-day operations, so you can keep violation counts low and stay away from the city’s increasing trends.
If you want a closer look at each agency’s violations over the past four years, you can access our full data report here. For any questions on how your team can level up your compliance strategy, email sales@sitecompli.com.